Investor Behavior and Capital Market Efficiency
Lucas S. Macoris
Outline
This lecture is mainly based the following textbooks:
Study review and practice: I strongly recommend using Prof. Henrique Castro (FGV-EAESP) materials. Below you can find the links to the corresponding exercises related to this lecture:
\(\rightarrow\) For coding replications, whenever applicable, please follow this page or hover on the specific slides with coding chunks
Competition and Capital Markets
Competition and Capital Markets
Our previous lecture showed us the backbone of the Capital Asset Pricing Model, also known as CAPM
- The CAPM allows us to price the required returns for any given security given its relationship with the market portfolio
- However, to reach such result, we have made some assumptions regarding the dynamics of investors and the market
What if these assumptions are not met? How does that impact the insights derived from the CAPM?
In this chapter, we will discuss several inefficiencies and biases that appear in the stock market
Capital Market Dynamics
The CAPM tells us that there is only one efficient portfolio, and this portfolio is the market portfolio
However, how can we identify the market portfolio? It is important to note the following aspects regarding this point:
- The market is always getting new information. Therefore, security prices are always adjusting…
- …as a consequence, this makes the efficient portfolio move from time to time…
- …and as such, investors will rebalance their portfolios continuously to meet the new efficient portfolio
All in all, the CAPM is an equilibrium model. This means that all investors will converge to the same portfolio until new information arrives, but there is no such th
Beating the market
- Say that you are evaluating the performance of several stocks relative to their expected returns. To improve the performance of their portfolios, investors will compare the expected return of a security \(i\) with its required return from the security market line:
\[R_i = R_f + \beta_S \times (E[R_m - R_f])\]
- Now, after calculating expected returns for \(i\), you go ahead and compare it with the actual, realized return that \(i\) gave during a given period:
\[\alpha_i = \underbrace{E[R_i]}_{\text{Observed by the analyst}} - \underbrace{R_i}_{\text{Implied by the CAPM}}\]
\(\rightarrow\) \(\alpha\) is the difference between a stock’s expected return and its required return according to the Security Market Line
Interpreting \(\alpha\)
\[\small \alpha_i = \underbrace{E[R_i]}_{\text{Observed by the analyst}} - \underbrace{R_i}_{\text{Implied by the CAPM}}\]
- A positive alpha means that the stock is above the SML
- In words, the expected return is higher than its required return. Before prices adjust, investors will anticipate that the price will rise and will likely put in buy orders at the current prices
- A negative alpha means that the stock is below the SML
- The expected return is lower than its required return. Before prices adjust, investors will anticipate that the price will fall and will likely put in sell orders at the current prices
\(\rightarrow\) In either case, we’ll be able to improve portfolio results. However, as we do so, prices will change and their alphas will shrink toward zero!
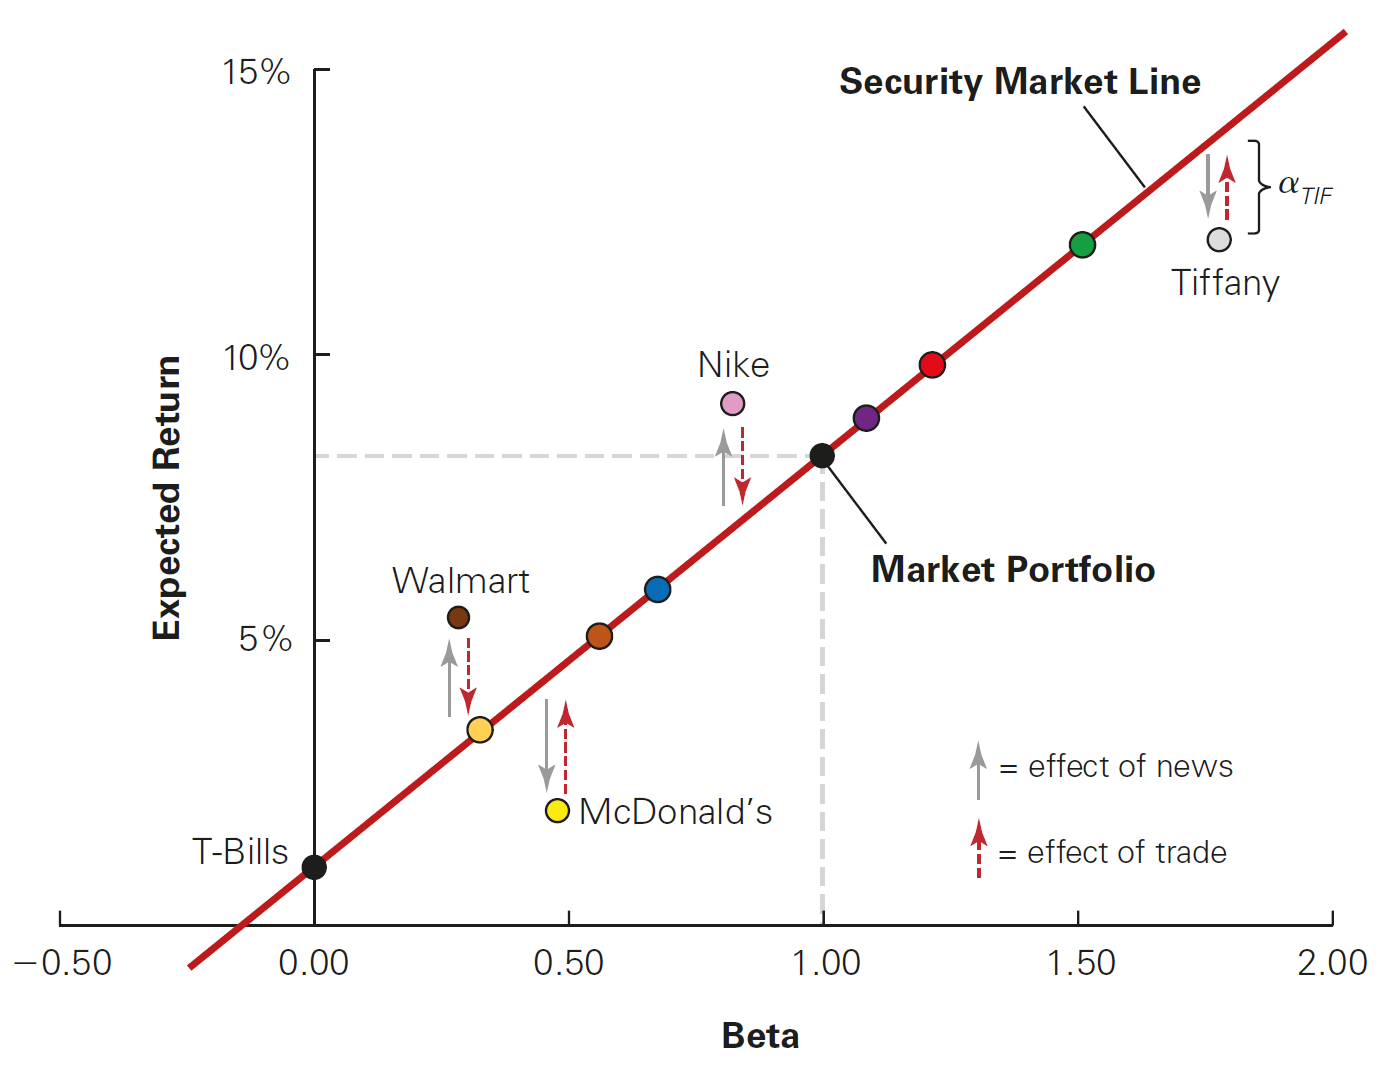
Interpreting \(\alpha\), graphical intuition
Beating the Market and Market competition
Let’s analyze what happens in the previous figure:
- Stocks above the SML are cheap, so the prices should rise (positive alpha)
- Stocks below the SML are expensive, so the prices should drop (negative alpha)
Because of that, we say that the CAPM is also a competitive market in equilibrium:
- Investors trying to “beat the market” are always looking for stocks with positive alpha (Walmart and Nike) to buy
- Once they buy them, prices rise, making stocks once again on the Security Market Line
There is a competition in the market and that competition brings efficiency to the CAPM! Note that such competition may be so intense that prices move before any investor can actually trade at the old prices, so no investor can profit from the news
Information & Rational Expectations
Information & Rational Expectactions, theory
In the CAPM world, investors should hold the market portfolio combined with \(R_f\). Why? Recall that we have assumed that investors had homogeneous expectations (Assumption #3). However, for the CAPM to hold, we only need a Rational Expectations Hypothesis:
- All investors correctly interpret and use their own information, as well as information that can be inferred from market prices or the trades of others
- Regardless of how much information an investor has access to, he/she can guarantee a zero \(\alpha\) by holding the market portfolio
Therefore, the market portfolio can be inefficient only if a significant number of investors:
- Misinterpret information and believe they are earning a positive alpha when they are actually earning a negative alpha, or
- Care about aspects of their portfolios other than expected return and volatility, and so are willing to hold inefficient portfolios (in terms of risk and return) of securities
Information & Rational Expectations, practice
In the real world, what usually happens is that informed investors (i.e, those that have more attention, such as security analysts, professional traders, fund managers etc) get the information and trade faster than naive investors
This unbalance of information makes the market not fully efficient sometimes (especially when new information arrives)
- If all investors had the same information, when new information arrives, the prices wouuld adjust right away, often without trade
- As some investors have (or process) the information faster than others, the market portfolio may not reflect the the efficient one
The Behavior of Individual Investors
The Behavior of Individual Investors
- If there is something that may put the market portfolio away from the efficient portfolio, it has to do with how investors make decisions around their portfolios
- In this subsection, we discuss several biases that individual investors have when building their personal portfolio
- Some of these individual biases included, but are not limited, to:
- Familiarity bias
- Relative Wealth Concerns
- Overconfidence
- Sensation Seeking
Individual Bias #1: Underdiversification bias
By appropriately diversifying their portfolios, investors can reduce risk without reducing their expected return. In that sense, diversification is a “free lunch” that all investors should take advantage of
One bias that appears in many countries is the underdiversification bias. In other words, there is much evidence that individual investors fail to diversify their portfolios adequately
Some potential explanations for the underdiversification bias are:
Familiarity Bias: investors favor investments in companies with which they are familiar
Relative Wealth Concerns: investors care more about the performance of their portfolios relative to their peers
Individual Bias #2: Excessive Trading and Overconfidence
According to the CAPM, investors should hold risk-free assets in combination with the market portfolio of all risky securities
Because the market portfolio is a value-weighted portfolio, it is also a passive portfolio in the sense that an investor does not need to trade frequently to maintain it
Empirical evidence shows that individual investors often trade beyond what is predicted by the CAPM. Some reasons may include:
- Overconfidence Bias: like sports fans, investors believe they can pick winners and losers when, in fact, they cannot; this leads them to trade too much! Furthermore, men tend to be more overconfident than women, with more trading and lower returns
- Sensation Seeking: an individual’s desire for novel and intense risk-taking experiences
By the simple fact that naive investors trade too often, they should get lower returns due to trading costs (brokerage costs, fees, etc)
Biases and the CAPM
If investors do not hold the market portfolio, does it mean that CAPM is not a good model?
- If individuals depart from the CAPM in random ways, then these departures will tend to cancel out
- These naive investors might only be trading erratically, thus not really affecting the market
This should not put us far from what is predicted by the CAPM: if investors are just departing from the the market porfolio in random ways, it should still be the efficient portfolio…
…if that is true, under which circumstances the CAPM implication that the market portfolio is efficient fail?
- If investors depart from the market portfolio in a consistent and predictable manner, imparting systematic uncertainty into prices
- For investors’ trades to be correlated in this way, they must share a common motivation, which we’ll refer to as a “systematic bias”
Systematic Trading Biases
For the behavior of individual investors to impact market prices, and thus create a profitable opportunity for more sophisticated investors, there must be predictable, systematic patterns in the types of errors individual investors make
Much of these biases are studied within a relatively new field of behavioral economics (and behavioral finance)
As we’ll see in the upcoming slides, there are some predictable, systematic patterns in the types of errors individual investors make and that would create a profit opportunity for sophisticated investors that include, but are not limited, to:
- Disposition Effect
- Investor attention, Mood, and Experience
- Herd Behavior
Systematic Bias #1: Disposition Effect
- An investor holds on to stocks that have lost their value and sell stocks that have risen in value since the time of purchase
- Suggests a reluctance to “admit a mistake” by taking the loss, which is more common in non-sophisticated investors
- This behavioral tendency to sell winners and hang on to losers is costly from a tax perspective: as capital gains are taxed only when the asset is sold, it is optimal for tax purposes to postpone taxable gains by continuing to hold profitable investments
- Hanging on to losers and selling winners might make sense if investors forecast that the losing stocks would ultimately “bounce back” and outperform the winners going forward.
- While investors may in fact have this belief, it does not appear to be justified in practice, as “losing stocks” continue to underperform the “winner stocks” that were sold
\(\rightarrow\) See Thinking, Fast and Slow, by Daniel Kahneman
Systematic Bias #2: Attention-grabbing stories and mood
Individual investors generally are not full-time traders. As a result, they have limited time and attention to spend on their investment decisions, and so may be influenced by attention grabbing news stories or other events
Studies show that individuals are more likely to buy stocks that have recently been in the news, engaged in advertising, experienced exceptionally high trading volume, or have had extreme returns
A recent study from Brazil shows that living in a small city close to a firm’s local store more than doubles the likelihood of an individual picking its stock to day-trade - see here
Furthermore, there also seems to be the case that investors mood is a relevant driver:
- Sunshine generally has a positive effect on mood, and studies have found that stock returns tend to be higher when it is a sunny day at the location of the stock exchange
- People who grew up and lived during a time of high stock returns are more likely to invest in stocks than are people who experienced times when stocks performed poorly
Systematic Bias #3: Herd Behavior
Thus far, we have considered common factors that might lead to correlated trading behavior by investors, such as psychological biases that affected all investors. But what if investors are actually trying to mimic each others behavior?
We call herd behavior a situation when investors make similar trading errors because they are actively trying to follow each others behavior
- Non-sophisticated investors might believe others have superior information that they can take advantage of by copying their trades
- Due to relative wealth concerns, individuals choose to herd in order to avoid the risk of underperforming their peers
(Coordinated) Herd Behavior - The Reddit - Wall St. Bets coordination
In late January 2021, Reddit traders took on the short-sellers by forcing them to liquidate their short positions using GameStop stocks. This coordinated behavior had significant repercussions for various investment funds, such as Melvin Capital - see here.
GameStop (ticker: GME) during the Wall Street Bets frenzy
Implications of Systematic Behavioral Biases
If non-sophisticated individual investors are engaging in strategies that earn negative alphas, it may be possible for more sophisticated investors to take advantage of this behavior and earn positive alphas at their expense
What is surprising, however, is that these mistakes persist even though they may be economically costly and there is a relatively easy way to avoid them: buying and holding the market portfolio!
Regardless of why individual investors choose not to protect themselves by holding the market portfolio, the fact that they don’t has an important implication for the CAPM: when individual investors make mistakes, sophisticated investors may earn a positive return at the expense of the non-sophisticated ones!
The Efficiency of the Market Portfolio
The Efficiency of the Market Portfolio
When individual investors make mistakes, can sophisticated investors easily profit at their expense? In other words, are these biases systematic and pervasive enough so that sophisticated investors can profit from them?
In order for sophisticated investors to profit from investor mistakes, two conditions must hold:
- The mistakes must be sufficiently pervasive and persistent to affect stock prices - they need to push prices so that the non-zero \(\alpha\) opportunities become apparent
- There must be limited competition to exploit these non-zero alpha opportunities - if competition is competition is too intense, these opportunities will be quickly eliminated before any trader can take advantage of them in a significant way
In what follows, we’ll see some potential evidence that individual or professional investors can outperform the market without taking on additional risk
Trading on News: takeover announcements
A natural place to look for profitable trading opportunities is in reaction to big news announcements or analysts’ recommendations: if enough other investors are not paying attention, perhaps one can profit from these public sources of information
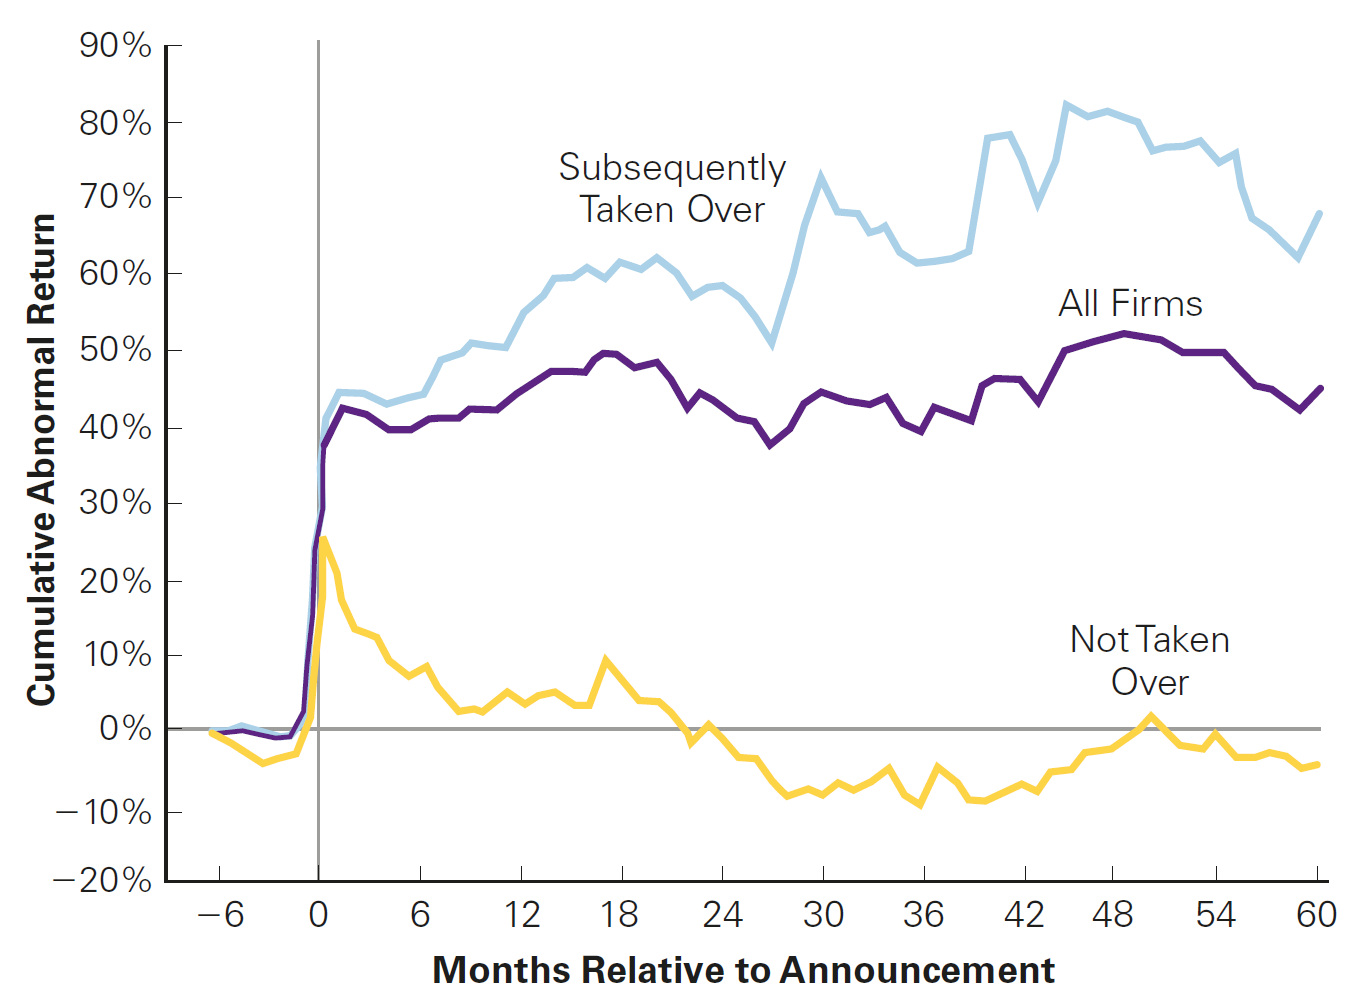
For example, investors can try to profit from takeover offers (Mergers and Acquisitions):
- Typically, the offer has for a significant premium to the target’s current stock price
- While the target’s stock price typically jumps on the announcement, it often does not jump completely to the offer price
- As a result, a reasonable trading strategy would be to buy at the announcement and sell after during the effective takeover
However, there is uncertainty regarding i) if the deal will actually occur; and ii) conditional on occurring, if it will be at the previous offer price
Predict whether the firm would ultimately be acquired, we could earn profits trading on that information
Trading on News: takeover announcements, illustration
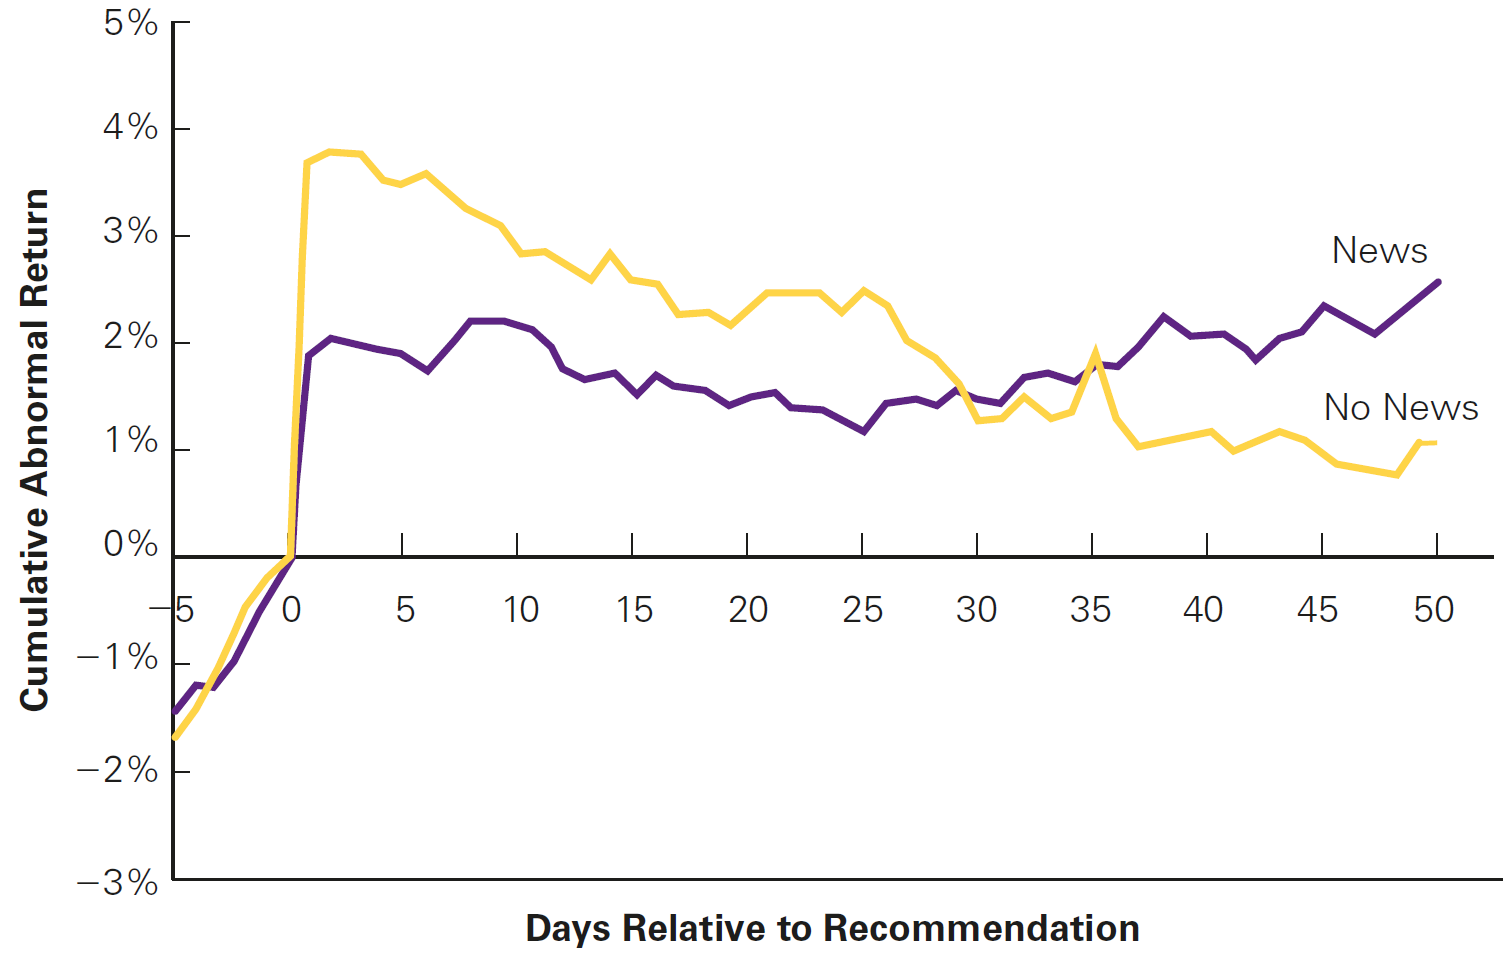
Trading on News: Stock Recommendations
You may have heard about Jim Cramer, from Mad Money, or other “stockpicker” social influencers covering financial markets. Do investors profit from following recommendations from these influencers? Evidence shows that:
In the case where there is news about the stock that is being recommended, it appears that the stock price correctly reflects this information the next day, and stays flat (relative to the market) subsequently
On the other hand, for the stocks that have been recommended, but without relevant news, there appears to be a significant jump in the stock price the next day, but the stock price then tends to fall relative to the market over the next several weeks
These “losing stocks” tended to be smaller, suggesting that individual investors who buy these stocks based on Cramer’s recommendation pushed the price too high
So why don’t we bet against Jim Cramer? As a matter of fact, someone did - see here
Mad Money Jim Cramer effect
Mad Money Jim Cramer effect
Performance of fund managers
After these disappointing evidence, you decide not to try actively beating the market - the best you can do is to hire someone that is a more informed investor than you. Will this strategy pay out? Empirical evidence shows that:
- The average mutual fund manager can generate value (before computing trading costs and fees, i.e., “gross alpha”)
- The median mutual fund manager, on the other hand, destroys value
- Only a small portion of managers are skilled enough to add value, according to this reference, in terms of net alpha
Because individual investors pay fees to fund managers, the net alpha is negative - you should be better-off by putting your money on a passively-managed fund!
That is, on average, fund managers (“active” strategies) do not provide value after fees, comparing to index funds (“passive strategies”)
Performance of fund managers, continued
If fund managers are high-skilled investors, why they have a hard time adding value?
One reason why it might be difficult to add value is because there is a trap of liquidity:
- If a manager is perceived as skilled, the deposits will grow, making harder to find above-average investment opportunities - that is why you see a lot of closed-end funds
- Performance would converge to the mean, at best
At the end of the day, the market is competitive and people profit following the theoretical predictions
- Skilled managers are recompensated for their skills. They capture the economic rents associated with their skills
- Investors are not recompensated for the skills of the managers they select - in the end, they derive little benefit, because this superior performance is captured by the manager in the form of fees
The Efficiency of the Market Portfolio: between winners and losers
We saw a series of potential biases that appear in real financial markets and how they can impact investor behavior
To what it concerns us, we should ask yourselves: is this changing the CAPM prediction? As it stands, the evidence seems to support the CAPM prediction that investors should still hold the market portfolio!
All in all, beating the market should requires special skills or lower trading costs, which uninformed, individual investors don’t have
Style-Based Techniques & efficiency
Style-Based Techniques & efficiency
In the previous section, we discussed potential biases that individual investors might have
All in all, they all point to the fact that sophistication plays a role:
- More sophisticated investors should be less prone to individual and systematic biases (in theory, at least)
- As a consequence, uninformed, low-skilled investors would be better-off if they simply hold the market portfolio
In particular, many fund managers distinguish their trading strategies based on the types of stocks they tend to hold; specifically, small versus large stocks, and value versus growth stocks
In what follows, we will consider these alternative investment styles, and see whether some strategies have generated higher returns historically than the CAPM predicts
Size Effect
Idea: small market capitalization stocks have historically earned higher average returns than the market portfolio, even after accounting for their higher betas. A way to replicate this thesis is to split stocks each year into 10 portfolios by ranking them based on their market capitalizations:
- The first portfolio had the 10% smallest stocks in terms of market capitalization
- The second portfolio had the 20% smallest stocks; and so on, until…
- The tenth portfolio had the 10% biggest stocks in terms of market capitalization
Calculating the monthly excess returns and the beta of each decile portfolio, we see that:
- Portfolios with higher betas yield higher future returns (as expected)
- Most portfolios were above the security market (\(\small \alpha>0\)). The smallest deciles exhibit the most extreme effect - See (Berk and DeMarzo 2023) for a detailed explanation and an illustrative example (“Risk and the Market Value of Equity”)
Book-to-Market Ratio
As with Size, a similar rationale could be applied to stocks that have higher levels of market-value of Equity vis-a-vis their historical values (book value of Equity)
Idea: small market capitalization stocks have historically earned higher average returns than the market portfolio, even after accounting for their higher betas
- High book-to-market stocks have historically earned higher average returns than low book-to-market stocks
- Stocks with high book-to-market ratios are value stocks, and those with low book-to-market ratios are growth stocks
As before, value stocks tend to present positive \(\alpha\)
Momentum
Do past returns explain future performance? Ideally, that shouldn’t be the case, but…
Idea: rank stocks each month by their realized returns over the prior 6–12 months. They found that the best-performing stocks had positive alphas over the next 3–12 months:
- This evidence goes against the CAPM: When the market portfolio is efficient, past returns should not predict alphas
- As an investor, you could buy stocks that have had past high returns and (short) sell stocks that have had past low returns
\(\rightarrow\) Click here for an application that simulates a momentum-based strategy for U.S. stocks
- All in all, these three factors (Size, Book-to-Market, and Momentum) are widely famous as the three Fama-French factors
What if \(\alpha\) is consistently different from zero?
- Let’s go back to our \(\alpha\) definition for a given stock \(i\):
\[ \alpha_i = E[R_i] - R_i \]
As we discussed, if you assume that CAPM is the correct model to explain expected returns, competition in financial markets should make \(\alpha \rightarrow 0\) in equilibrium:
- Stocks above the SML are cheap, so the prices should rise (positive alpha).
- Stocks below the SML are expensive, so the prices should drop (negative alpha).
However, over the years since the discovery of the CAPM, it has become increasingly clear that forming portfolios based on market capitalization, book-to-market ratios, and past returns, investors can construct trading strategies that have a positive alpha
Why? There can be two reasons why positive-alpha strategies exist in a persistent way
Why \(\alpha\) is consistently different from zero?
Reason #1: Investors are systematically ignoring positive-NPV investment opportunities:
- The CAPM correctly computes required risk premiums, but investors are ignoring opportunities to earn extra returns without bearing any extra risk
- That could happen either because they are unaware of them or because the costs to implement the strategies are larger than the NPV of undertaking them
\(\rightarrow\) This explanation goes straight to the hypotheses outlined by the CAPM!
According to the CAPM, the only way a positive-NPV opportunity can persist in a market is if some barrier to entry restricts competition. Nowadays, this hypothesis seems unlikely:
- Information required to form the portfolios is readily available;
- Trading costs are decreasing
Why \(\alpha\) is consistently different from zero? Continued
Reason #2: The positive-alpha trading strategies contain risk that investors are unwilling to bear but the CAPM does not capture:
A stock’s beta with the market portfolio does not adequately measure a stock’s systematic risk
Because of that, the CAPM does not correctly compute the risk premium as it leaves out important risk factors that investors care about!
In other words way, the profits (positive alphas) from the trading strategy are really returns for bearing risk that investors are averse to but the CAPM does not capture
As a consequence, the market portfolio is not efficient. The next slide discuss some reasons why the market portfolio might not be the efficient one
Potential explanations
Some reasons of why positive-alpha strategies can persist can be inherently tied to the assumptions tied out to the CAPM definition:
Proxy error: we might be not using a good proxy for the market portfolio
Behavioral biases: we have made assumptions on investor behavior, but it might be the case that non-sophisticated investors find hard do approximate their portfolio to the market portfolio
Alternative Risk Preferences and Non-Tradable Wealth:: we assumed that investor would always seek for the best risk \(\times\) return combination. However, investors may stick with inefficient portfolios because they care about risk characteristics other than the volatility of their traded portfolio. For instance, they prefer to not be exposed to the sector they work in or to specific industries (i.e., ESG-based decisions)
Multifactor Models of Risk
Multifactor Models of Risk
- We previously defined that the required return for any given security \(i\) should follow:
\[ E[R_i] = R_f + \beta_i^P \times (E[R_P - R_f]) \]
- At first, we were agnostic on what \(P\) should stand for
- When we introduced the CAPM, we claimed that \(\small P=M\) - i.e, the efficient portfolio is the market portfolio
- However, we saw several real-world frictions that might yield us the uncomfortable outcome that market portfolio is not efficient!
\(\rightarrow\) When the market portfolio is not efficient, we have to find a method to identify an efficient portfolio before we can use the above equation!
Multifactor Models of Risk
When we introduced the CAPM, we implicitly assumed that there was a single portfolio (or “factor”) that represented the efficient portfolio: the market (a “single factor” portfolio)
However, it is not actually necessary to identify the efficient portfolio itself, as long as you identify a collection of portfolios from which the efficient portfolio can be constructed
A Multi-Factor Model is a pricing model that uses more than one portfolio (“factors”) to approximate the efficient portfolio:
\[ \small E[R_i] = R_f + \beta_i^{\text{F1}} \times \underbrace{(E[R_{\text{F1}} - R_f])}_{\text{Excess return for Factor 1}}+ \beta_i^{\text{F2}} \times \underbrace{(E[R_{\text{F2}} - R_f])}_{\text{Excess return for Factor 2}}+...+\beta_i^{\text{Fn}} \times \underbrace{(E[R_{\text{Fn}} - R_f])}_{\text{Excess return for Factor n}} \]
- Each \(\beta_i^{n}\) here is called a factor beta: like the CAPM, it is the expected % change in the excess return of a security for a 1% change in the excess return of that factor portfolio, holding everything else constant
Multifactor Models of Risk, continued
The previous equation showed that that we can write the risk premium of any marketable security as the sum of the risk premium of each factor multiplied by the sensitivity of the stock with that factor:
- Single-factor: We use an presumably efficient portfolio, it will alone capture all systematic risk (for example, the CAPM)
- Multifactor: If we use multiple portfolios as factors, then together these factors will capture all systematic risk - this is also known as the Arbitrage Pricing Theory (APT)
Multifactor models allow investors to break the risk premium down into different risk factors:
- As they might not be equally averse to the different factors, multifactor models allows investors to tailor their risk exposure
- This idea of tailoring risk exposures based on common risk factors has become increasingly known amongst practitioners as a smart beta strategy - click here for an extensive list of factor ETFs from Fidelity
Which factors (portfolios) to use?
If investors can tailor their risk exposure to specific risk factors, then the next question is: which risk factors an investor should be exposed to? Some examples:
Market Strategy: the most straightforward example is to expose to the market itself, like the CAPM did. Even if the market portfolio is not efficient, it still captures many components of systematic risk
Market Capitalization Strategy: a trading strategy that each year buys portfolio S (small stocks) and finances this position by short selling portfolio B (big stocks) has produced positive risk-adjusted returns historically. This is called a small-minus-big (SMB) portfolio
Book-to-Market Strategy: a trading strategy that each year buys a portfolio of growth stocks and finances it by selling value stocks. This is called a high-minus-low (HML)) portfolio
Past Returns Strategy: a portfolio that goes long the top past-return stocks (1 year) and short the bottom ones. The resulting self-financing portfolio is known as the prior one-year momentum (PR1YR) portfolio
Example: Fama-French-Carhart (FFC):
- A direct application of the previous slide is the Fama-French-Carhart (FFC) portfolio, which aggregates all the risk factors discussed before:
\[\small E[R_i] = R_f + \beta_s^m \times \underbrace{(E[R_m]− R_f)}_{\text{Market}} + \beta_s^{SMB} \times \underbrace{E[R_{SMB}]}_{\text{Size}} + \beta_s^{HML} \times \underbrace{E[R_{HML}]}_{\text{Market Cap.}} + \beta_s^{Mon} \times \underbrace{E[R_{Mom}]}_{\text{Past Returns}} \]
- Note that we can price the required returns for a given security \(i\) according to its exposure (the \(\beta\)’s) to each of the factor portfolios
- Before, we claimed using the CAPM that only the first factor should drive required returns (i.e., the market)
- Now, our measure for the efficient portfolio is to say that investors also care about other risk factors, and because of that, the exposure of a given security needs to take that into account when estimating the required returns!
Fama-French-Carhart portfolio returns
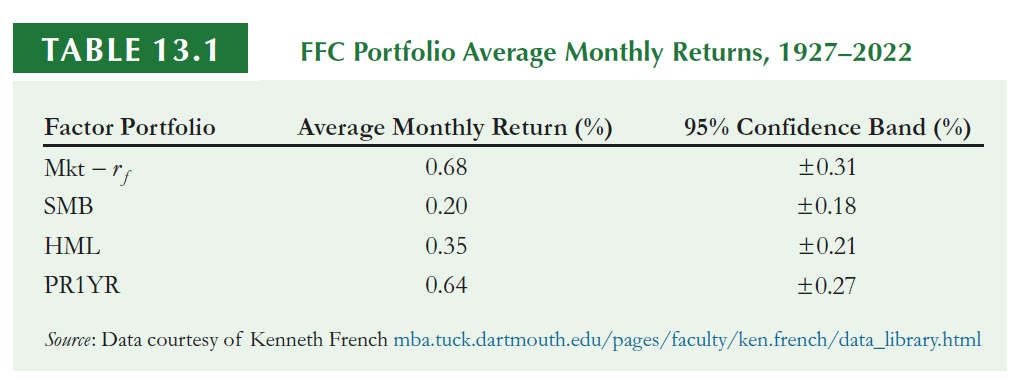
- These are the returns for investing in each portfolio
- If the investment that you are trying to estimate the required returns is exposed to these portfolios, we then use these estimates with the estimates \(\beta\)’s to get to the expected return
Multifactor Models of Risk, example
- You are considering making an investment in a project in the fast food industry. You determine that the project has the same level of non-diversifiable risk as investing in McDonald’s stock. Determine the cost of capital by using the FFC factor specification assuming a monthly risk-free rate of 0.20% and the factor returns from the previous slide.
| Factor | Beta |
|---|---|
| Market | 0.72 |
| SMB | -0.6 |
| HML | 0.14 |
| PR1YR | 0.09 |
Multifactor Models of Risk, example
- Using the FFC specification:
\[ \small \underbrace{0.2}_{\text{Risk-free}}\%+\underbrace{(0.68\%-0.2\%)}_{\text{Market Excess Return}}\times{0.72}+\underbrace{(0.2\%)}_{SMB}\times{-0.6}+\underbrace{(0.35\%)}_{HML}\times{0.14}+\underbrace{(0.64\%)}_{PR1YR}\times{0.09}=0.68\% \]
In annual terms (no compoundind), this is approximately \(\small 0.68\% \times 12=8.16\%\)
As a comparison, a standard CAPM regression over the same time period leads to an estimated market beta of \(\small 0.58\) for McDonald’s —the market \(\beta\) differs from the estimate of 0.72 above because we are using only a single factor in the CAPM regression
Using the CAPM would have given us an estimated annual required return of \(\small (0.2\%+0.58\times0.68\%)\times12=7.1\%\)
Methods Used in Practice
Given the evidence against and in favor of the CAPM and market efficiency, is the CAPM used in real-world applications?
According to Financial Managers:
- A survey of CFOs found that 73.5% of the firms used the CAPM
- 40% used historical average returns
- 16% used the dividend discount model
- Larger firms were more likely to use the CAPM than were smaller firms
According to investors: Investors
- In a recent study of the different risk models examined, investor behaviorwas found to be most consistent with the CAPM.
- The idea of this study is that by observing which investments investors rush into, it is possible to infer the risk model they are using
Practice
Important
Practice using the following links:
Supplementary Material: an interview with Eugene Fama
Eugene Fama is widely known for his “Efficient Markets Hypothesis”. But what does it mean in practice? Do we really believe in efficient markets? Click here for an interview with Eugene Fama - access via Financial Times.
\(\rightarrow\) All FGV-EAESP students are entitled to a Financial Times subscription at no cost.
References
Berk, J., and P. DeMarzo. 2023. Corporate Finance, Global Edition. Global Edition / English Textbooks. Pearson. https://books.google.com.br/books?id=m78oEAAAQBAJ.
Brealey, R. A., S. C. Myers, and F. Allen. 2020. Principles of Corporate Finance. The Irwin/McGraw-Hill Series in Finance, Insurance, and Real Estate. McGraw-Hill Education. https://books.google.com.br/books?id=nsrHuwEACAAJ.