import pandas as pd
import numpy as np
import statsmodels.api as sm
from matplotlib import pyplot as plt
from plotnine import *
from great_tables import GT, md
from mizani.formatters import percent_format
from mlxtend.frequent_patterns import apriori
from mlxtend.frequent_patterns import association_rulesMarket Basket Analysis
Lucas S. Macoris (FGV-EAESP)
Tech-setup
Tech-setup
All coding steps will be done using Python. If you need help on setting up your machine, please refer to this link for help
- Before you start, make sure to import and load all the necessary packages:
Thinking about consumer choices
- Many firms compile records of customer transactions. These records are very valuable to marketers and inform us about customers’ purchasing patterns:
- What are the ways in which we might optimize pricing or inventory given the purchase patterns?
- Which relationships between the purchases and other customer information are more prevalent?
Such records may comprise an enormous number of data points yet with relatively little information in each single observation
Our last lecture will examine a strategy to extract insight from transactions and co-occurrence data: association rule mining
Hands-On Exercise
Description
- You work as a big CPG retailer and just received access to its transaction database related to a sizable sample of their grocery sales. More specifically, the data set comprises lists of items purchased together (i.e, market baskets), where the individual items have been recorded as category labels instead of product names (i.e, sausages, ketchup, beer, etc). You have been prompted with the following task:
- Which categories are frequently bought together?
- Which action plans would you recommend and what should be the estimated effect?
- You can download the
groceries.csvdata using the Download button below.
Note: the groceries dataset has been adapted to fit the purpose of the lecture. You can find the original dataset here
\(\rightarrow\) This example has been taken from (Chapman and Feit 2015)
Thinking about consumer choices
Intuition: when events occur together more often than one would expect from their individual rates of occurrence, such co-occurrence is an interesting pattern
- People tend to buy beer and olives together
- Pasta consumption tends to be positively related to spices and sauces
It is all about the conditional expectation!
- Suppose that sausages represent 5% of the transaction
- Also, ketchup brands represent 3% of the transactions
If the proportion of the hot-dog sales that also have ketchup is \(\small3\%\), then there is no significant relationship because this is what we would expect from the overall data
If, on the other hand, the proportion of ketch-up sales is \(\small25\%\) given a hot-dog sale, this indicates that the conditional probability given a hot-dog transaction is relevant!
Methodological terms
One way we can define these relationships is to characterize each situation:
An association is simply the co-occurrence of two or more things. Example: sausages and ketchup tend to be in the transaction
A transaction is a set of items that co-occur in an observation. In marketing, a common transaction is the market basket: \(\{\text{sausages},\text{sauces},\text{mustard},\text{beer}\}\)
A rule expresses the incidence across transactions of one set of items as a condition of another set of items. A condition in this sense does not imply a causal relationship, only an association of some strength, whether strong or weak
- Translating our example using these terms, if we identify that ketch-up is generally bought along with sausages and sauces, then we have the following rule:
\[ \small \{\text{sausage},\text{mustard}\}\implies\{\text{ketchup}\} \]
Metrics
- Association rules are expressed with a few common metrics that reflect the rules of conditional probability:
The support is the proportion of all transactions that contain the set. If the set \(\small \{\text{sausage},\text{ketchup}\}\) appears in 10 out of 200 transactions, the support is \(\small 0.05\). What matters is that these items were in 10 transactions together - other items may be included.
The confidence is the support for the co-occurrence of all items in a rule, conditional on the support for the left hand set alone:
\[ \small \text{Confidence}(\text{sausage}\implies \text{ketchup})=\dfrac{\#(\text{sausage } \cap \text{ketchup})}{\#\text{sausage}} \]
- For example, if sausage appears in \(\small200\) transactions overall, and \(\small50\) of these also contain ketchup, the confidence is \(\small 50/200 = 25\%\). In words, ketchup appears \(\small25\%\) of the time that sausage appears
Metrics
- Note that Confidence in this context carries no implication about hypothesis testing, confidence intervals, or the like; it is only a measure of conditional association. Likewise, Confidence is not symmetric. If \(\small Support(\text{\{Sausage\}})\neq Support(\text{\{Ketchup\}})\):
\[ Confidence(\text{sausage}\implies\text{ketchup})\neq Confidence(\text{ketchup}\implies\text{sauage}) \]
- How we can use these concepts to create “success” metrics for some associations? One of the most common ways is to define an increase (or “lift”):
\[ lift(\text{sausage}\implies\text{ketchup})=\dfrac{support(\text{sausage }\cap \text{ketchup})}{support(\text{sausage })\times support(\text{ketchup})} \]
Understanding lift
- Lift measures how the joint probability of the events compares to the case where the events are independent. If the individual appearances from sausage and ketchup are 75 and 80, respectively, we have:
\[ \small \dfrac{(50/200)}{\bigg(\dfrac{75}{200}\times\dfrac{80}{200}\bigg)}=\dfrac{0.25}{0.375\times0.4}\approx 1.66 \]
The combination of sausages and ketchup is \(\small66\%\) higher than what we would expect if these items were bought independently!
This provides us with a metric of how relevant this association is, and we can take this into account when thinking about how we can exploit them in terms of marketing campaigns
Wrapping up on metrics
- Support, Confidence, and Lift tell us different things. When we search for some specific rules, we wish to find rules such that:
Exceed a minimum threshold on each item: sets that occur relatively frequently in transactions (high Support)
Shows strong conditional relationships (Confidence)
Are more common than chance (Lift)
- In what follows, we will use the
groceriesdataset to extract relevant combinations of purchases, calculate co-occurrence metrics, and devise action plans based on our findings
Reading the data
   Unnamed: 0  Member_number        Date itemDescription
0           1           1808  2015-07-21  tropical fruit
1           2           2552  2015-01-05      whole milk
2           3           2300  2015-09-19       pip fruit
3           4           1187  2015-12-12            beer
4           5           3037  2015-02-01      whole milk
5           6           4941  2015-02-14      rolls/buns
6           7           4501  2015-05-08            beer
7           8           3803  2015-12-23      pot plants
8           9           2762  2015-03-20      whole milk
9 10 4119 2015-02-12 tropical fruitDescribing the Top 10 Categories
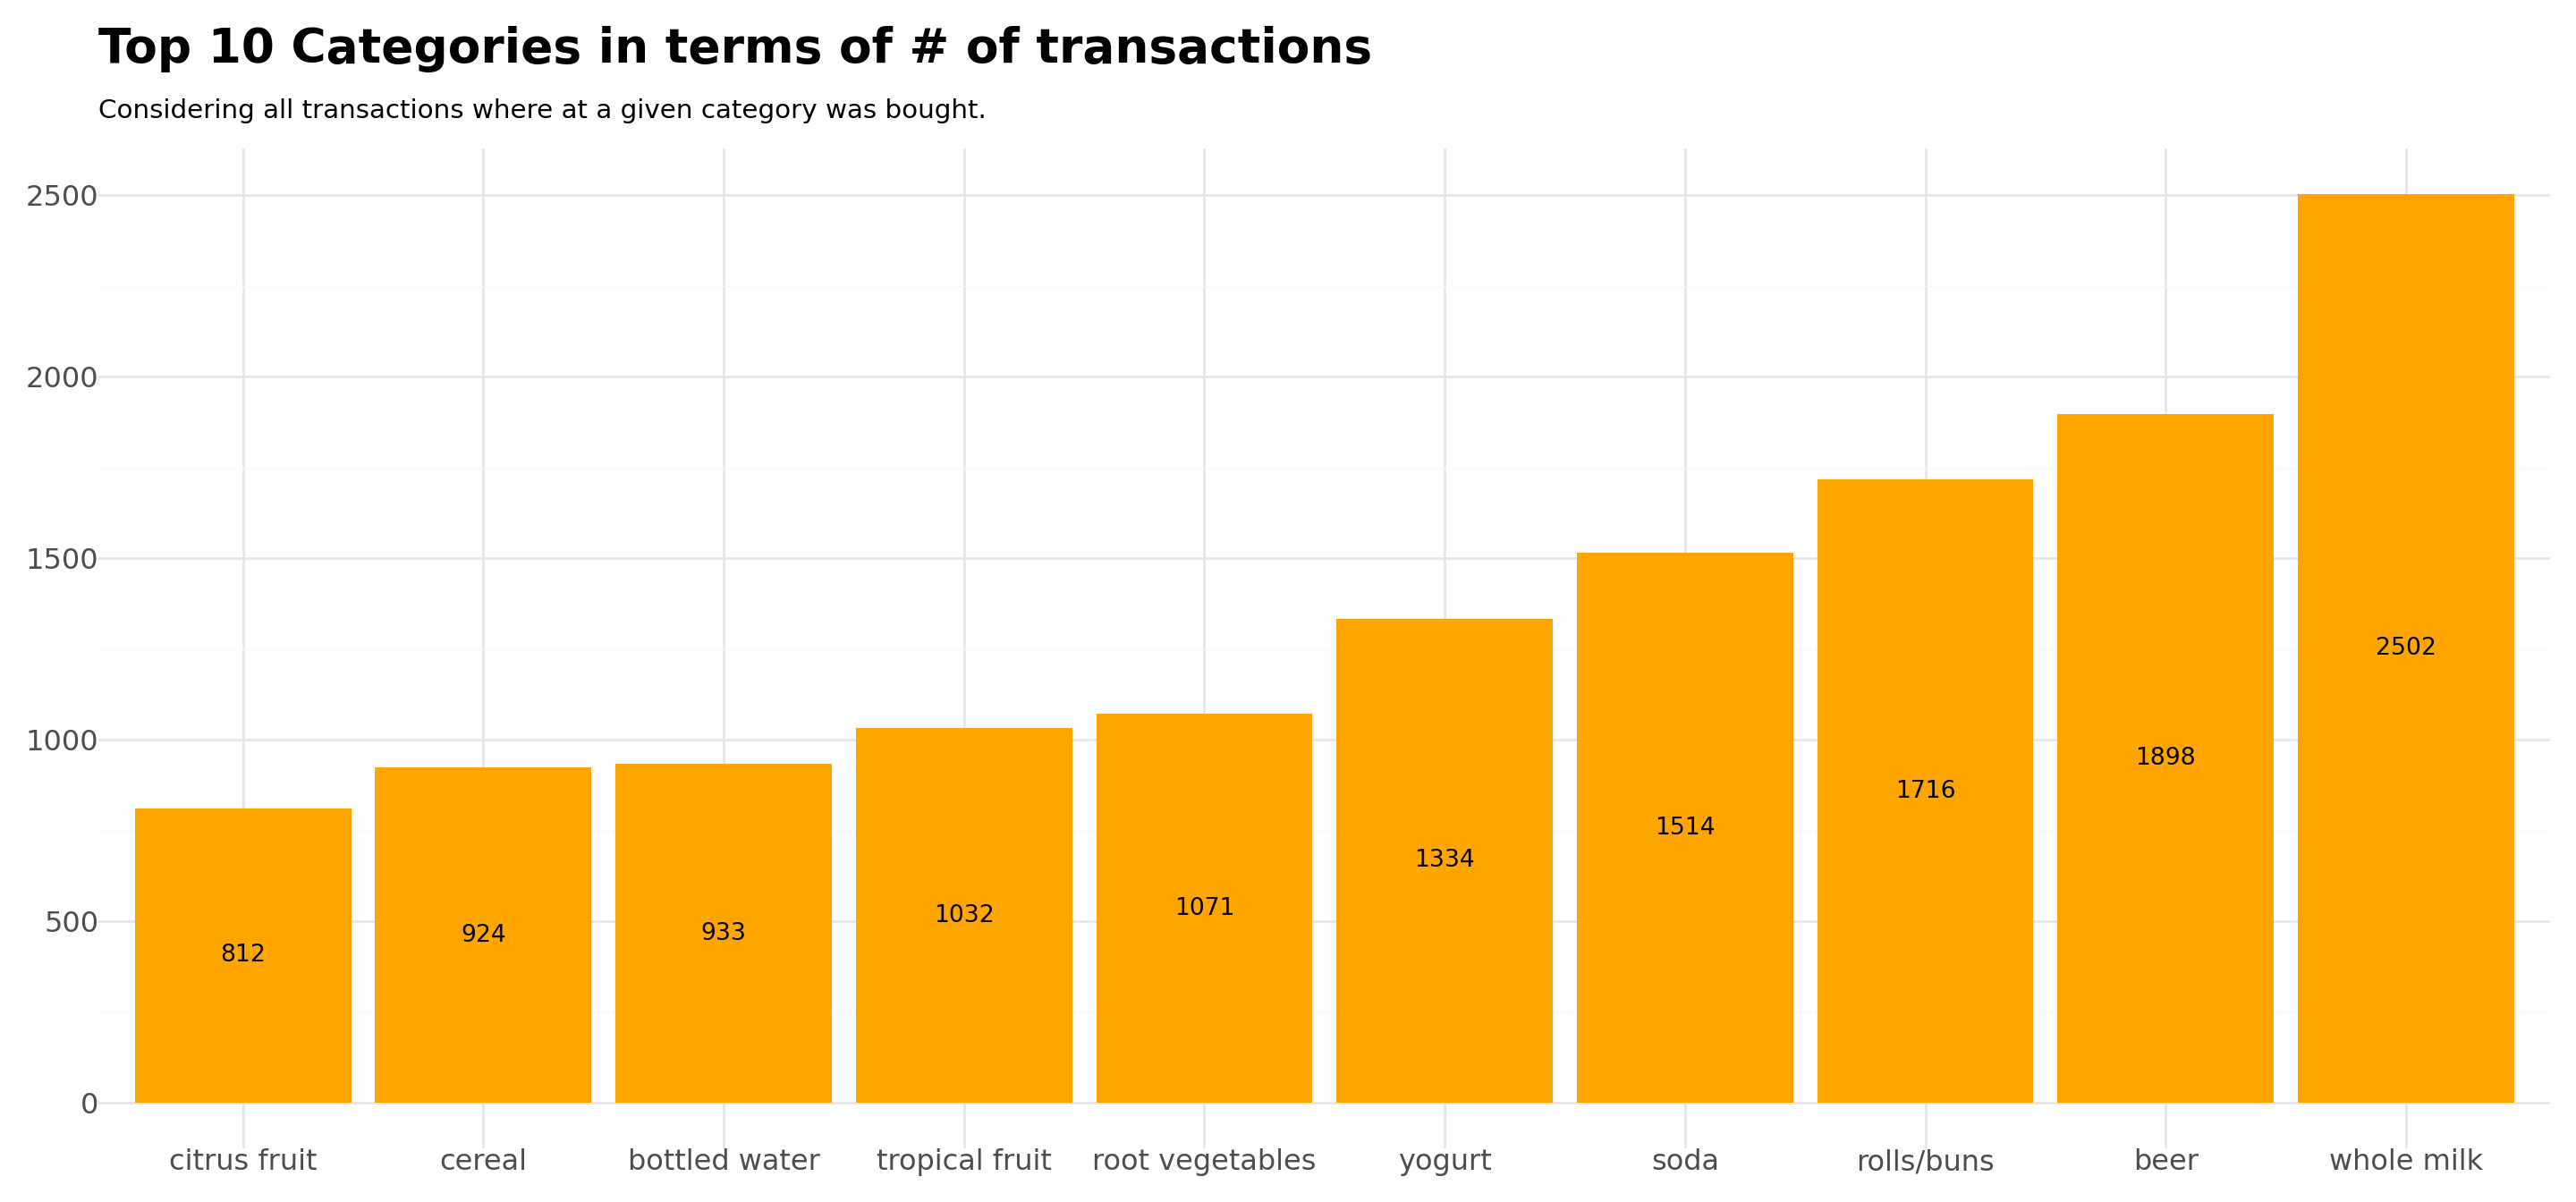
top10=data.groupby(['itemDescription']).size().sort_values(ascending=False).head(10).reset_index()
top10.columns=['Category','Transactions']

theme_plots= theme(
  legend_position='bottom',
  axis_title=element_text(face='bold',size=10),
  plot_title=element_text(face='bold',size=15)
  )

Plot = (
  ggplot(top10, aes(x='reorder(Category,Transactions)', y='Transactions'))+
  geom_col(fill='orange')+
  geom_text(aes(label=top10['Transactions']),size=10, color='black',position=position_stack(vjust=0.5))+  # Add annotations
  labs(
    title='Top 10 Categories in terms of # of transactions',
    subtitle='Considering all transactions where at a given category was bought.',
    x='Category',
    y='# of Transactions')+
  theme_minimal()+
  theme(
    legend_position='bottom',
    axis_title=element_blank(),
    axis_text=element_text(size=12),
    plot_title=element_text(face='bold',size=20),
    figure_size=(15,7)
    )
  )

#Display Output
Plot.show()
Looking for Association Rules
How we can look for meaningful associations between items bought together?
First, we need to transform our dataset in such a way that it has the following structure:
- Each row represents one transaction - i.e, a Customer \(\times\) Date
- Each column represents a specific category
- For each cell, we’ll do one-hot-encoding: if a given transaction happened to have a category in its basket, we’ll assign \(\small1\). If not, we will assign zero
In this way, we’ll get the dataset in the correct format to start thinking about our three metrics: support, confidence, and lift
| Transaction-based data | |||||
|---|---|---|---|---|---|
| berries | beverages | bottled beer | bottled water | brandy | |
| 1023-2014-06-13 | 0 | 0 | 0 | 0 | 0 |
| 1023-2014-12-30 | 0 | 0 | 0 | 0 | 0 |
| 1023-2015-01-06 | 0 | 0 | 0 | 0 | 0 |
| 1023-2015-06-28 | 1 | 0 | 1 | 0 | 0 |
| 1024-2015-08-10 | 0 | 0 | 0 | 0 | 0 |
| 1025-2014-02-06 | 0 | 0 | 0 | 0 | 0 |
| 1025-2014-03-10 | 0 | 0 | 0 | 0 | 0 |
| 1025-2015-08-19 | 0 | 0 | 0 | 0 | 0 |
| 1026-2014-03-08 | 0 | 0 | 0 | 0 | 0 |
| 1026-2014-06-18 | 0 | 0 | 0 | 0 | 0 |
data['Quantity'] = np.full_like(data['itemDescription'], 1).astype(int)
data['Invoice'] = data["Member_number"].astype(str) + '-' + data["Date"].astype(str)

basket = (data.groupby(["Invoice","itemDescription"])["Quantity"].
          sum().
          unstack().
          reset_index().
          fillna(0).
          set_index("Invoice")
          )

def encode(x):
    if x==0:
        return 0
    if x>=1:
        return 1

basket_encode = basket.map(encode)


Table = (
  GT(basket_encode.iloc[90:100,10:15].reset_index())
  .cols_align('center')
  .tab_header(title=md("**Transaction-based data**"))
  .tab_stub('Invoice')
  .fmt_number(decimals = 0)
  .opt_stylize(style=1,color='red')
)

#Output
Table.tab_options(table_width="100%",table_font_size="25px")
Creating Rules
With the dataset already in place, we can start looking for reasonable associations
As transactions dataset tend to have a reasonably high number of items, we may want to switch our attention to items that represent a given threshold of support
We will look for items that represent, at least, \(\small0.5\%\) of the transactions (\(\small \approx 20\) times)
Conditional on these items, we’ll look for all combinations and check for the ones that we have reasonable lift
We’ll export our results to a
.csvfile for easier manipulation
      antecedents     consequents  ...  certainty  kulczynski
0   (frankfurter)          (beer)  ...   0.016154    0.089214
1          (beer)   (frankfurter)  ...   0.004558    0.089214
2        (yogurt)        (cereal)  ...   0.007000    0.081082
3        (cereal)        (yogurt)  ...   0.010239    0.081082
4        (cereal)          (soda)  ...   0.001611    0.079906
5          (soda)        (cereal)  ...   0.000962    0.079906
6  (bottled beer)    (whole milk)  ...  -0.000126    0.101549
7    (whole milk)  (bottled beer)  ...  -0.000032    0.101549
8        (cereal)    (whole milk)  ...  -0.011316    0.102551
9    (whole milk)        (cereal)  ...  -0.003875    0.102551

[10 rows x 14 columns]Discussion - Market Basket Analysis
All in all, we were able to find four rules with relevant lift levels:
- \((Frankfurter \implies Beer)\)
- \((Beer \implies Frankfurter)\)
- \((Yogurt \implies Cereal)\)
- \((Cereal \implies Yogurt)\)
Which marketing actions can be done based on this information?
- Promotions: buy one, get discount on the other
- In-store management: place items near the same aisle
- Coupouning: provides coupons for joint purchases
- Special packs
Discussion - Market Basket Analysis (continued)
Market-basket analysis (and association rules in general) are not testing hypothesis, but simply finding potentially reasonable associations!
Bridging association rules with decision-making: one can leverage the relevant associations and do a series of other studies in such a way to understand consumption patterns:
Understand socioeconomic characteristics of individuals who had the relevant association rules (who they are, what they eat, how much they spend, etc)
Conduct qualitative surveys to understand the specific reasons why the association is appearing (randomness? soccer games?)
Perform other statistical analyses to analyze the data
Conduct experiments: what if we halve the price of beer but increase the price of frankfurters? Is this going to generate higher profits?
Other choice-based applications not covered
- Marketers also have a wide range of other techniques that can be used to draw relevant insights from transaction data - those include, but are not limited, to:
Cojoint Analysis: understand how customers value different features, helping to determine the optimal combination of attributes that maximize preferences and willingness to pay:
- How much users are willing to pay for ad-free vs. premium content?
- Do customers care more about organic ingredients or low calories?
Multi-touch Attribution: determine how different customer touchpoints contribute to conversions throughout the consumer journey:
- What are the most influential touchpoints (e.g, Google Search, META, TikTok)? How users interact before conversion?
\(\rightarrow\) For an in-depth discussion of other methodologies applied to a marketing context, refer to (Chapman and Feit 2015)
Wrapping-up: what’ve done so far
- So far, you looked at how consumers make binary choices, both on a binary and multinomial fashion…
- And saw ways to understand associations between different but related choices
Looking ahead
Explore different classification models that seek to provide similar answers
Bridge traditional econometrics with the recent machine learning literature: cross-validation, train/test sets, hyperparameter tuning etc
If your interest is on causality, we need to think about clever ways to insulate our models from ommited variable bias
Think about when you need to use a more complex model, and why!
I hope you had as much fun as I did!
References
Chapman, Chris, and Elea Mcdonnell Feit. 2015. R for Marketing Research and Analytics. Cham: Springer International Publishing.