Introduction and Course Overview

Lucas S. Macoris

This page was intentionally left blank

Welcome to the Course

  1. Overview and Course Organization
  2. Grading and Evaluations
  3. Navigating through the syllabus
  4. How you can get the best of this course
  5. Overall Q&A

Overview

  • With the recent advances in technical resources and the vast availability of financial information, finance practitioners are required to generate reproducible and scalable analysis in a timely fashion to guide decision-making:

    1. How can I continuously optimize the risk-return trade-off of my portfolio over time?
    2. What is the sensitivity of my investment decisions to changes in growth rates, discount rates, and expected margins?
    3. How can I assess the ability of a given trading strategy to outperform the market over time?

\(\rightarrow\) To that point, departing from the general tools, such as Excel, to more advanced tools, such as and , is an imperative change!

  • The goal of this course: translate theoretical concepts learned on the core finance courses to practical applications that can guide decision making in real-world financial markets

Course Structure

  • This is a hands-on, practical course on Quantitative Finance with applications using and , two of the most widely used open-source software for data analysis. It will be structured in topics that are of interest to Finance practitioners, aiming to include, but not limited to:

    1. Collecting and organizing financial data
    2. CAPM, Fama-French, and multi-factor models of risk
    3. Equily Valuation, sensitivity analysis, and Simulation
    4. Portfolio optimization and strategy backtesting
    5. Event Analysis
    6. Sentiment Analysis
  • Students are also expected to interact with leading industry practitioners focused on financial applications using open-source languages, aiming to discover more about the possibilities of applying the skills learned in this course in the financial industry

Bibliography

Important

Most of the references listed in this bibliography have an open-source version that is hosted online, where you can copy-paste code chunks directly into your session. All contents with restricted access will be provided upfront.

Grading and Evaluations

Grading will be composed of the following activities:

  1. Handout Data Cases (40%)
  2. Capstone Project (40%)
  3. Project Showcase (15%)
  4. In-class Participation (5%)
  • You can find the details of any of these activities in the official syllabus (available on eClass®)
  • In case of any questions, feel free to reach out to lucas.macoris@fgv.br

Office-hours

I also host office-hours (by appointment) on Thursdays, 5PM-6PM. In these sessions, I’ll be more than happy to help you with anything you need from this course. Use the Office-hour Appointments link at the bottom of this slide to schedule an appointment (or click here).

Getting the best of this course

Getting the best of this course, continued

  • Tech setup: in the official page of your course, you will find instructions on how to properly set up your computer in terms of downloading all necessary softwares, packages, and customizing your session1

  • Code Replication: right after we are done with a given topic, try to replicate the in-class handouts on your end and check if you are able to yield the same outputs

  • Showcase: programming, data science, analytics, machine learning, and so on…these terms are on the hype of today’s job market - although few people really know how to make meaningful impact with it. Use this course as an opportunity to differentiate and showcase the skills you’ve learned and stand out to potential employers2

On the usage of gen-AI

On the usage of ChatGPT and other gen-AI tools

Generative Artificial Intelligent (gen-AI) adoption is quickly spreading through corporate life and universities. At this point, it is worth the question…am I allowed to use gen-AI tools in this course?

  • The answer is yes! Not only you are allowed, but also encouraged to do so:
    1. Use gen-AI tools to proof-read your work, get insights, and troubleshoot errors
    2. Learn to be skeptical around the solutions you have been provided with
    3. Evaluations will be based on how you can interpret, understand, and showcase your solution to the broader audience!

How to use these slides

  • These slides leverage Quarto, an open-source scientific and technical publishing system from Posit (formerly RStudio):

    1. Create dynamic content with , , , among other programming languages
    2. Publish reproducible, production quality articles, presentations, dashboards, websites, blogs, and books in HTML, PDF, Word, ePub, and more
    3. Write beatufil, clean technical documents using markdown, including equations, citations, crossrefs, figure panels, callouts, advanced layout, and more
  • For our course, we’ll use the following notation:

  1. Links will be colored in blue
  2. Inline equations and variables will be rendered in gray
  3. Code chunks will be provided along with outputs (R)

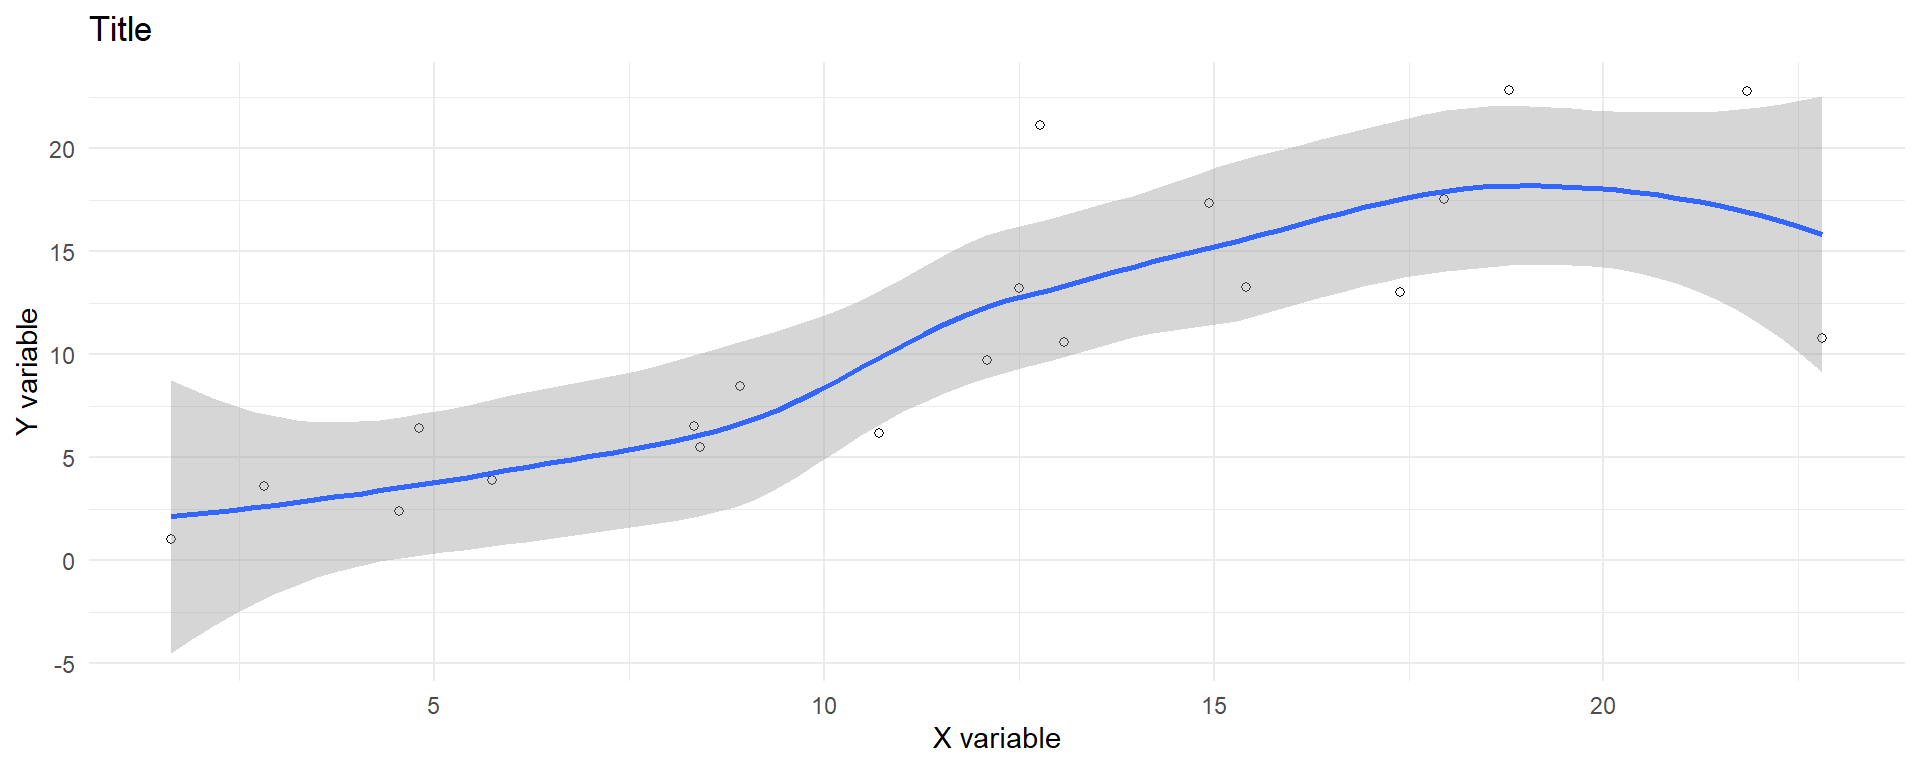
An example of a code chunk

Note

In the R panel, hit Show the Code to display the code inside the tabset. Hit the button at the top-right to copy it to your session.

library(ggplot2)
dat <- data.frame(cond = rep(c("A", "B"), each=10),
                  xvar = 1:20 + rnorm(20,sd=3),
                  yvar = 1:20 + rnorm(20,sd=3))

ggplot(dat, aes(x=xvar, y=yvar)) +
  geom_point(shape=1) + 
  geom_smooth()

Interactive Learning

Listing 1: We will extensively leverage interactive learning whenever possible. In selected sections, called Listings, you will be prompted with an interactive R console that you can use to run existing and new code to a “virtual” session. Try changing the ticker to NVDA and check if anything has changed.

Interactive Learning, continued

Listing 2: You can use the Hints and Solution buttons to interact with the prompt. Even if you submit the wrong answer, a live-tutoring feature will provide you with a handful of tips to adjust your code and resubmit your solution. For example, complete the code to read Microsoft price (MSFT.csv) data and select the latest 10 OHLC (Open, High, Low, Close) information. The dataset is arranged in descendant format (latest price information is at the bottom of the table).

You can access the names of the columns using names(Data) to find the column that refers to closing prices:

names(Data)

You can also select specific columns by using the select() function:

select(Data,c(column1,column2,...,column_n))`

First, use the names() function to retrieve the names of the columns available in the dataset.

After that, use the tail() function to retrieve only the latest 10 observations.

#Set the ticker Data=read.csv(glue('Assets/MSFT.csv')) Data=select(Data,c(Timestamp,Open,High,Low,Close)) Data=tail(Data,10) Data

#Set the ticker
Data=read.csv(glue('Assets/MSFT.csv'))
Data=select(Data,c(Timestamp,Open,High,Low,Close))
Data=tail(Data,10)
Data

Why R?

  • We will be using throughout the course. Although you should feel that this course is language-agnostic, R is among one of the best choices for the task:
  1. Free and open-source
  2. Diverse and active community working on a broad range of tools
  3. Actively maintained packages for various purposes - e.g., data manipulation, visualization, modeling, etc)
  4. Powerful tools for communication, such as Quarto and Shiny
  5. Smooth integration with other programming languages, e.g., SQL, Python, C, C++, Fortran
  6. RStudio is one of the best development environments for interactive data analysis
  7. Top-notch tools and packages for handling financial data and analysis1

Setting up your environment

  • As we get started, there are a couple of things you should remember:

    1. works with libraries, which consists of a bundle of functions, methods, data and other components that can be loaded in your session (i.e, as you open RStudio or any other IDE of your preference)

    2. To load a library, you call library(x), where x refers to the package name

    • If x is already installed in your computer, you are good to go
    • If, on the other hand, x is not installed, you need to call install.packages('x') before you attempt to load it
    1. install.packages() needs to be called once; library() needs to be called at the beginning of each session!

Setting up your environment, continued

  • To make things easier, ensure to install these packages in your computer and load it at the beginning of every session - I’ll make sure to update this list whenever needed throughout the sessions in the course’s official webpage
# Package names
packages <- c("tidyverse","tidyquant","tidymodels","xts","glue","scales","ggthemes")

# Install packages not yet installed
installed_packages <- packages %in% rownames(installed.packages())

if (any(installed_packages == FALSE)) {
  install.packages(packages[!installed_packages])
}

# Load all packages
lapply(packages, library, character.only = TRUE)

#Note that you could simply do it iteratively:

#Install if not already available
  #install.packages('tidyverse')
  #install.packages('tidyquant')
  #install.packages('tidymodels')
  #install.packages('xts')
  #install.packages('glue')
  #install.packages('scales')
  #install.packages('ggthemes')

#Load
  #library(tidyverse)
  #library(tidyquant)
  #library(tidymodels)
  #library(xts)
  #library(glue)
  #library(scales)

Other things you should consider: Quarto

  • In this course, you’ll be assigned with three data cases, where you’ll need to manipulate code and write your insights altogether. You may have heard of Jupyter Notebooks before as a way to do it. I want to encourage you to give Quarto a try

Other things you should consider: Quarto, continued

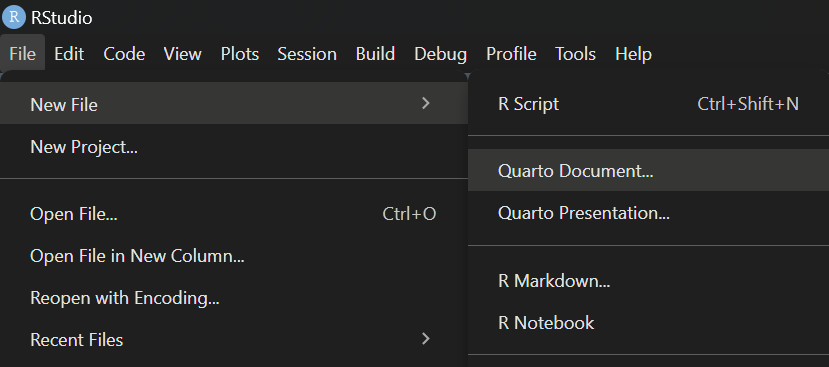
  • To install Quarto, follow this link and choose your Operating System. RStudio will automatically locate it and make it as an option:

Key Highlights:

  1. Multi-language support (Python, R, Julia, JavaScript) and seamless integration with GitHub
  2. Advanced document formatting and output options: you can choose pdf, html, docx, or even a reveal.js presentation (like the one you’re reading right now)

Getting started

  • To get started, you’ll need to:
  1. Install R using this link
  2. Install RStudio using this link
  3. Install Quarto using this link

Tech-setup

In the official webpage of this course, I have outlined all necessary steps to get started using R, as well as some useful tips for those that want to get up to speed on the course’s requirements - please follow this link and carefully read the instructions.

Course pre-assessment

  • Fill out the form below, share your thoughts, and help me tailor the course to meet your needs and track your progress 🙂

References

Berk, J., and P. DeMarzo. 2023. Corporate Finance, Global Edition. Pearson. https://books.google.com.br/books?id=m78oEAAAQBAJ.
Grolemund, Garrett. 2014. Hands-on Programming with R. Sebastopol, CA: O’Reilly Media.
Scheuch, Christoph, Stefan Voigt, and Patrick Weiss. 2023. Tidy Finance with R. Chapman & Hall/CRC. https://www.tidy-finance.org/r/.
Wickham, Hadley. 2021. Mastering Shiny. O’Reilly Media. https://mastering-shiny.org/.
Wickham, Hadley, Mine Cetinkaya-Rundel, and Garrett Grolemund. 2023. R for Data Science. O’Reilly Media. https://r4ds.had.co.nz/.